Esri has created a digital storytelling tool known as a StoryMap. A StoryMap is a web-based application that allows users to create and build stories with customized maps. Users can contextualize their narrative in a StoryMap by embedding text, images, videos, and online content (e.g. web apps, social media posts, dashboards, and websites) to their map. The application provides templates for users to choose from and guides within the application, making the storytelling tool user-friendly.
StoryMaps are versatile in the ways they can be applied. CITT has incorporated StoryMaps into several of its projects and has found the tool to be helpful, in particular, as a training and presentation aid. Projects that have benefitted from the use of StoryMaps include: Workforce Training & Career Development, Supply Chain Infrastructure, and GIS in Transportation Planning. In Workforce Training & Career Development, CITT has applied StoryMaps as a curricular tool in order to demonstrate how data can connect to image and narrative to tell a story about a particular project. This is particularly valuable when communicating with diverse audiences. In Supply Chain Infrastructure, CITT has used StoryMaps to share the results of research topics such as the impacts of COVID-19 on the supply chain. They are also useful as interactive maps to help visualize the supply chain throughout Southern California. For GIS in Transportation Planning, CITT has created StoryMaps that show how GIS is used as a tool in transportation planning and helps to reveal the unique characteristics of cities, communities and individual blocks.
Workforce Training and Career Development
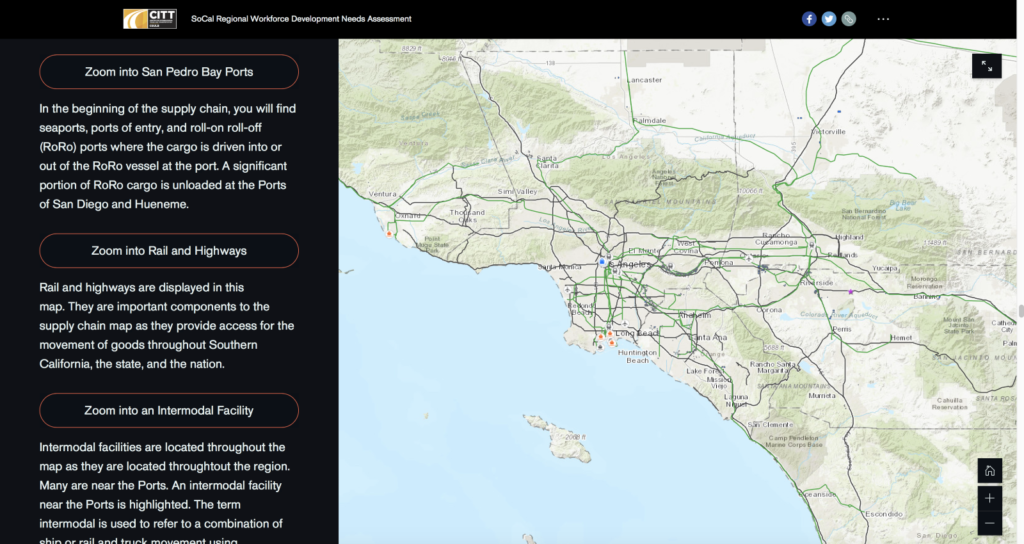
- Southern California Regional Workforce Development Needs Assessment for the Transportation and Supply Chain Industry Sectors: This story map presents promising practice recommendations for program content, design, and delivery with developments concerning the role of Institutes of Higher Education (IHEs) in workforce education for supply chain industry sectors.

- Visualizing Sustainable Transportation Choices for K-12: This story map provides a discussion on the benefits of introducing spatial thinking in K-12 education. GIS allows students to become spatial thinkers by collecting, analyzing, and visualizing their data. Visualizing their impact would help students participating in the GIS activity to strengthen their sustainable thinking.
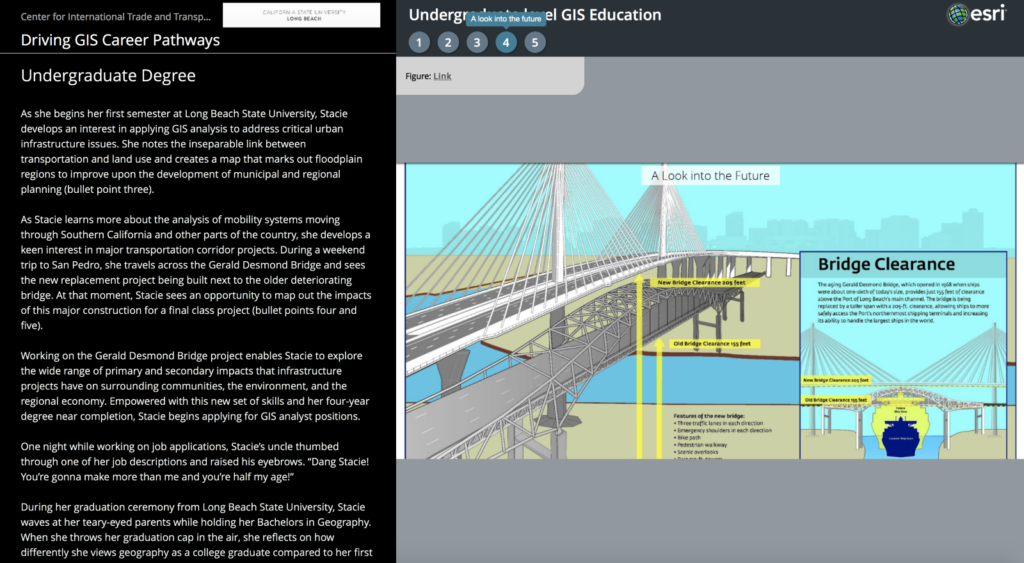
- Driving GIS Career Pathways: This story map provides a comprehensive summary of various steps necessary in choosing GIS as a career path. This demonstrates an individual’s journey from high school dual enrollment to obtaining an undergraduate degree and later joining the workforce.

- Top 25 Transportation Job Projections in the Southwest Transportation Workforce Center (SWTWC) Region: This story map highlights the top 25 job projections within each state in the SWTWC region and details about critical occupations and related labor market data.
Supply Chain Infrastructure
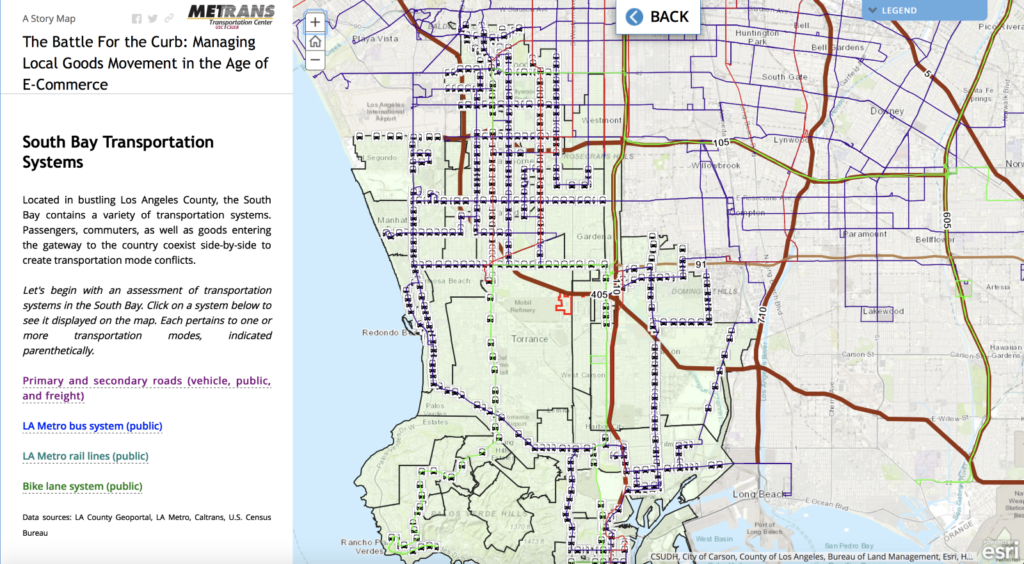
- The Battle for the Curb: Managing Local Goods Movement in the Age of E-Commerce: This story map provides various study areas and serves as an instructional tool in a pilot course for public and private professionals on biggest goods movement challenges in the 21st century occurring in last-mile and last foot urban freight planning.

- Freight Corridor Planning and Improvement: This story map provides a discussion on designing and planning more efficient ways to reliably move freight in specific freeway segments with high truck volumes at a more granular level in California’s Inland Empire warehousing region, Ontario, California.
- Maintaining and Improving Freight Corridors Using GIS: This story map provides a discussion on designing and planning more efficient ways to reliably move freight in specific freeway segments with high truck volumes at a more granular level in California’s Central Valley agricultural region, Sacramento, California.
- Digital Freight Matching Technology and the Role of GIS: This story map demonstrates the potential benefits of DFM on the Trucking industry and the importance of GIS in alleviating inefficiency and congestion problems in society.
GIS in Transportation Planning
- The Role of GIS in Protecting Cultural Resources: By incorporating an accessible data collection tool like Survey 123, transportation efforts can soon incorporate the protection and preservation of cultural resources.
- Assessing Los Angeles’ Complex Transportation Network: The story map emphasizes GIS and its importance in making well-informed decisions through the visualization of geospatial data, access of real-time transportation and survey data, and ability to perform comprehensive analyses on complex Los Angeles’s transportation datasets.
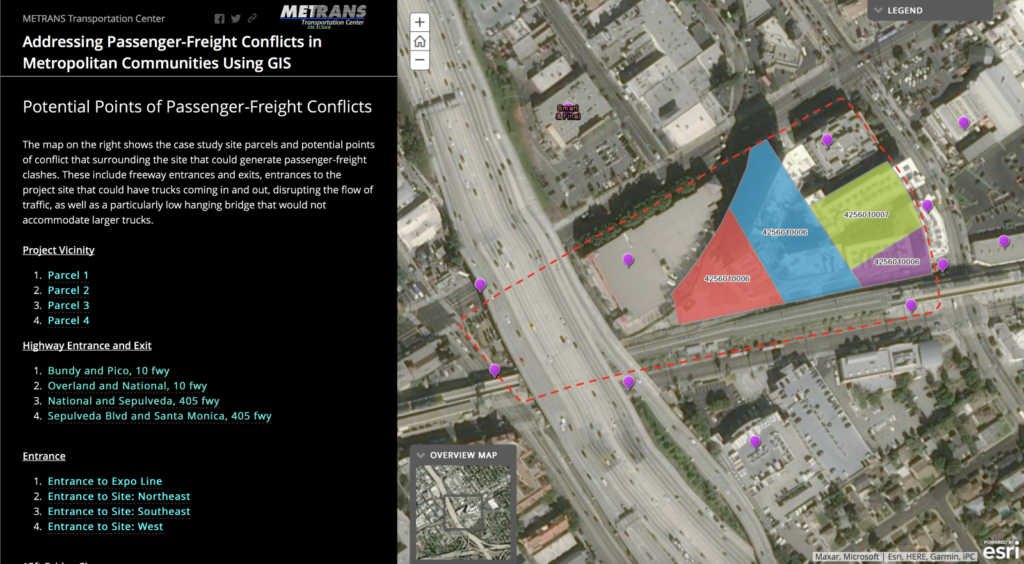
- Addressing Passenger-Freight Conflicts in Metropolitan Communities Using GIS: Visualizing and highlighting areas of conflict in metropolitan communities by collecting vital field data with GIS and other geospatial technologies will help the transportation and regional planners make intelligent and informed decisions.
